There are many phrases and terms related to bioinformatics and phylogenetics, this glossary provides a collection of terms and diagrams to explain underlying theory.
Phylogenetics and Cladistics
Phylogenetics
Anagenesis
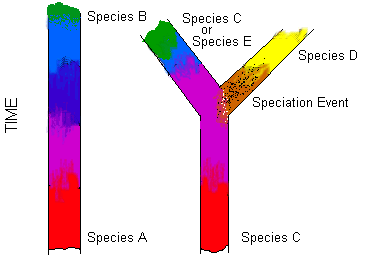
The process where a species gradually transitions into a new species. The change occurs across the entire population rather than a branching event, as in cladogenesis.
In anagenesis the ancestral species and the later species cannot exist at the same time, whereas in cladogenesis the ancestral species can exist at the same time.
E.g below on the left represents the change from species A to species B via anagenesis. Diagram on the right represents cladogenesis (see cladogenesis).
Bayesian phylogenetics
Similar to maximum likelihood phylogenetics (see ML trees) but allows incorporation of bayesian prior parameters e.g prior distributions for population size, mutation rate variation. Topology support is given in the form of posterior probabilities of nodes.
Binary trees
A tree that does not contain polytomies where each node has two descendants.
Bootstrap
Sampling with replacement, each pseudo-replicate is constructed by randomly sampling columns of the original alignment with replacement until an alignment of the same size is obtained.
This is repeated (usually 1000 times) and trees made for each pseudo-replicate. A percentage support value is given at each node that represents the percentage of bootstrap trees which share the same topology. Results should be taken with caution, bootstrapping only indicates the consistency of the data (very dependent on the underlying phylogenetic signal).
Branch
Horizontal lines on the tree. In a phylogeny their length is proportional to evolutionary change. The longer the branch the more change has occurred. In a phylogenetic tree branches are proportional to the number of substitutions per site. The length of a branch is called the branch length or edge length.
Branching order
The order of descent in a tree diagram. In a phylogeny the branching order shows the order of evolutionary descent from past to the present.
Branch length
‘The amount of character-state change occurring along a branch. This may be an integer in
the case of discrete characters, or a real number in the case of genetic distances that are continuous valued. In trees reconstructed with the aid of a probabilistic model, branch lengths usually refer to the expected (i.e., mean) number of changes occurring as an outcome of some probability of change over some duration’ (Sanderson 1998).
Clade
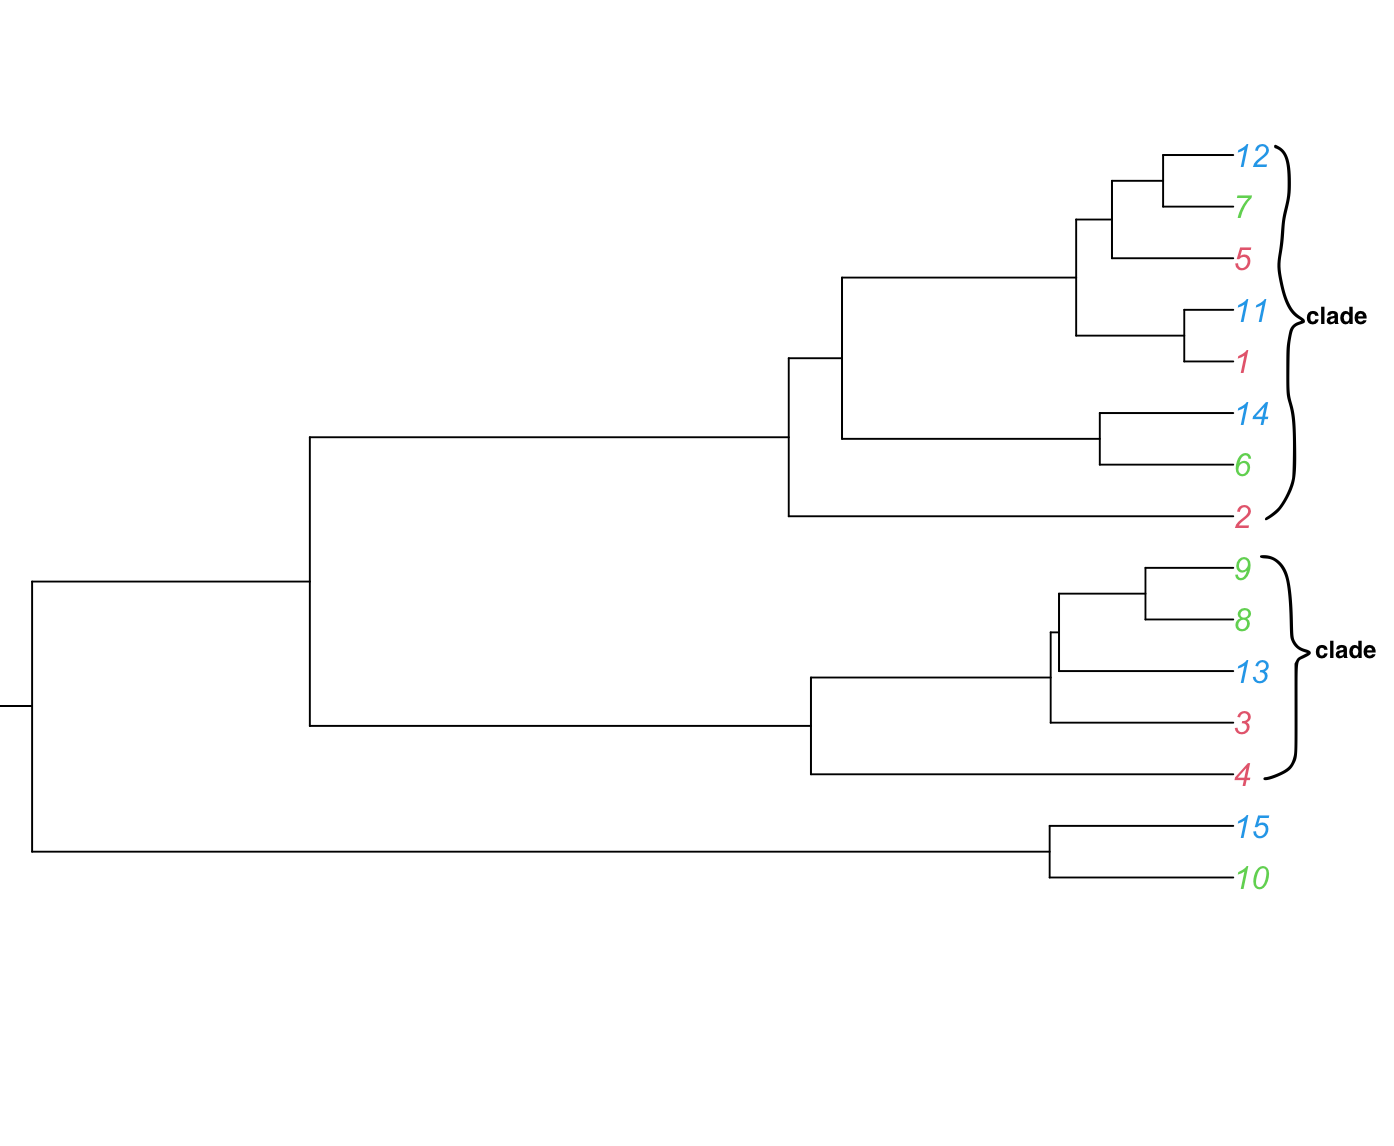
A group that includes all the descendants of a lineage as well as the most recent common ancestor of all of its members (also called a Monophyletic group). Clades can be nested in a hierarchy.
Cladogenesis
The process where a lineage splits rapidly into two new lineages.
Clan
A group in an unrooted tree defined through bipartition (note, not a clade as cannot infer order of ancestry).

Coalescence
Where two lineages merge or ‘coalesce’ backwards in time to a shared single common ancestor.
Complete lineage sorting
When the gene tree shows the same relationships as the population or species tree (also see Incomplete lineage sorting).
Condensed tree
Simplified version of a tree where low supported branches are collapsed under a given support threshold (usually 50-70%). Note that if a tree is condensed the branch lengths are no longer proportional and cannot be used.
Consensus tree
A tree produced by combining clades that occur in a given threshold of the resampled trees, where all trees were equally parsimonious. The threshold is the consensus support threshold. In a strict consensus tree this threshold is 100%, in a majority rule consensus tree the threshold is 50%.
Convergence
Similarities which have arisen independently in two or more organisms that are not closely related for example the evolution of wings in birds and mammals such as bats. See also convergent evolution.
Diverge
E.g species divergence is the accumulation of differences between closely related populations within a species, leading to the generation of a new species.
Divergence time
The time that has passed since one lineage split from another e.g humans and chimps diverged from a common ancestor around 4-6Mya (Million years ago). In a molecular clock tree divergence times are also called node heights.
Diversification
A process of change that occurs over time. E.g diversification event describes a point in time where we can see new lineages being formed.
Extant
Still in existence, opposite of ‘extinct’
Gamma
Shape parameter that describes rate variation or rate heterogeneity among sites along a DNA sequence. Used to describe rate variation alongside substitution models in phylogenetic analysis. (Occurs as different regions of the same sequence can be under different evolutionary pressures).

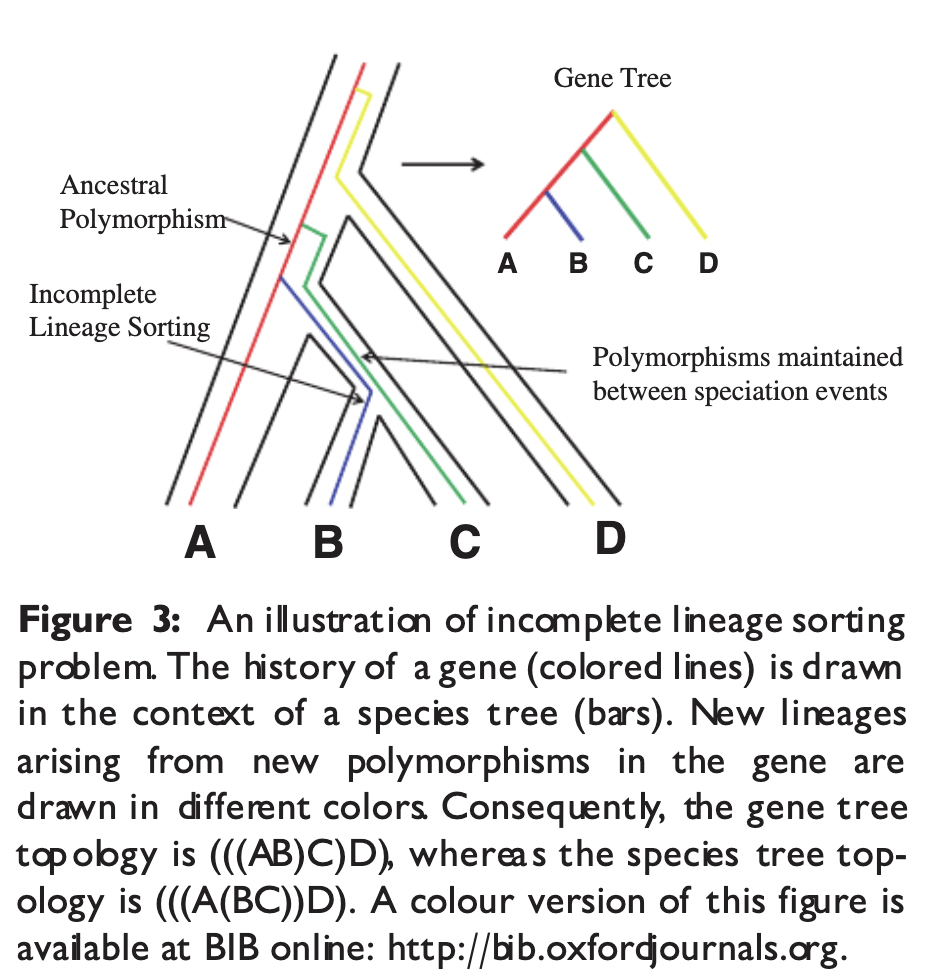
Incomplete lineage sorting
Also called ‘deep coalescence’, when gene lineages fail to coalesce within the species boundary.
When ancestral genetic polymorphisms persist during rapid speciation events the average divergence time between genes may differ from the divergence time between species. This complicates phylogenetic inference and can be seen in many lineages e.g hominids.
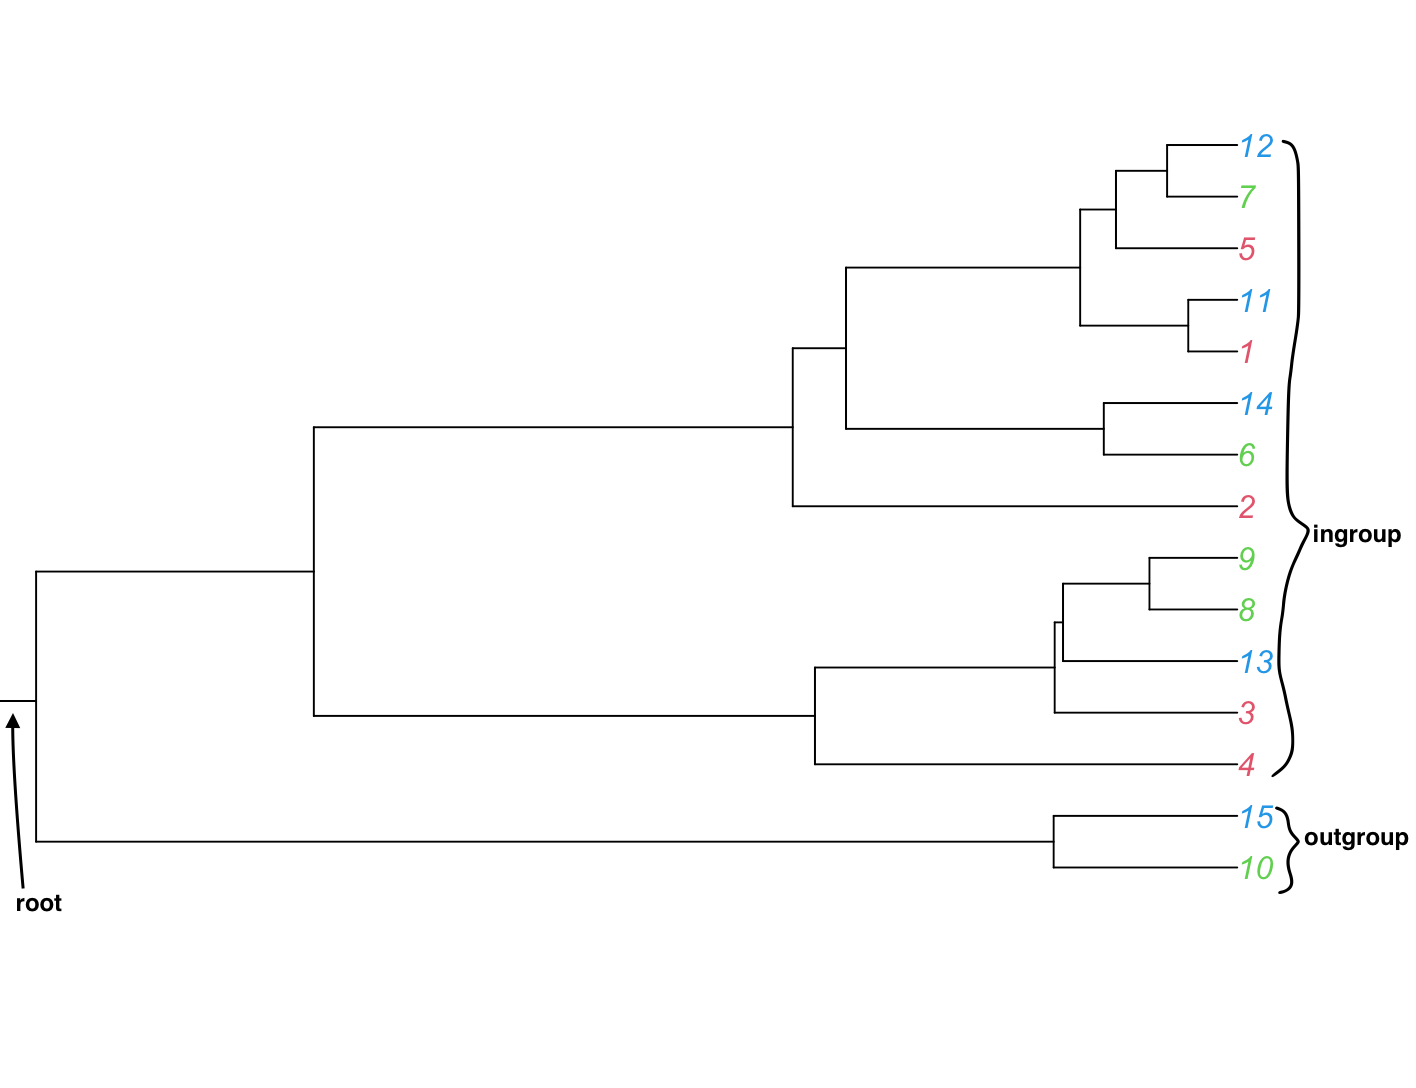
Ingroup
A group of taxa/tips in the tree that share a single common ancestor (you need to know this or assume this before you make the tree) also see Outgroup.
Invariable sites
Sites/nucleotides in the sequence that have remained the same over time.This quantity is used to describe rate variation among sites.
Jackknifing
Resampling by deleting a portion of the original observations for each pseudo-replicate with replacement. A 50% jackknife randomly deletes half of the columns from the alignment to create each pseudo-replicate.
Leaf/Taxon/Tip/Terminal node
Plural: leaves/taxa/tips/terminal nodes
The tips of the branches in a tree – more generally they are the data labels. Depending on the data used to make the tree they could represent a species/gene copy/population. Also called Operational taxonomic units (OTU).

Lineage
Continuous line of descent, from parent to offspring.
Long branch effect
When large differences between short and long branches lead to an incorrect tree topology. See here
Three classes of long branch effects:
I – Attraction of terminal taxa caused by symplesiomorphies, which results in a false monophyly of paraphyletic groups.
II – Caused by significant signal erosion. Long branches affected by this phenomenon can form false clades that would otherwise be polyphyletic.
III – Attraction of branches due similarity by chance or similarity through convergent evolution.
Monophyletic
The same as clade (see clade)
Molecular clock
The concept of using the steady accumulation of mutations over time in neutral genetic markers as a ‘clock’ to measure the absolute time that has passed between the branching of different lineages.
MRCA
Most recent common ancestor (an extinct organism that is related to living lineages). In a phylogeny the MRCA is represented by a node.
Maximum clade credibility tree
Or MCC tree is a summary tree for bayesian phylogenetic analysis. Looking at all of the trees produced during sampling, the maximum clade credibility tree is the one tree that has the largest sum of posterior probabilities across all branches.
Maximum likelihood trees
Phylogenetic trees produced using maximum likelihood methods (based on an initial tree NJ/UPGMA/Max parsimony) that includes a model of sequence evolution. Tree topology is given bootstrap support values from resampling. ML methods give a tree that maximises the likelihood of the genetic data in the sequence alignment.
Neighbour joining tree
Neighbours are defined as a pair of leaves with one node connecting them. The method finds pairs of leaves that minimise the total branch length at each stage of clustering, starting with a star-like tree. There is only one tree produced (though several possible trees may be likely) and the resulting tree has no root.
Node
A point where one lineage branches into two, representing a hypothesised ‘evolutionary event’ which separates two lineages e.g speciation or the process of one species splitting into two.
Node height
Sum of the branch lengths from the root to a node.
Node depth
The number of tips descending from each node.
Outgroup
Also called the basal group. A species or species group that is not closely related to the ingroup. These species are carefully chosen (*see long branch effect) and are necessary to give the tree a direction of time. See also Ingroup
Paraphyletic
Group of organisms that does not include all of the descendants of the common ancestor. E.g below, 7 is not included in our selection.

Also see Monophyletic,Polyphyletic.
*Note that Paraphyletic, Monophyletic,Polyphyletic are terms just used to describe groupings of organisms on the tree that we are interested in studying.
Parsimony
Concept of the simplest explanation being the most likely.In phylogenetics parsimony methods are used to find the minimum number of evolutionary steps to describe evolutionary relationships between species or populations.
Patristic distance
Sum of branch lengths that link two nodes in a tree – the nodes are usually terminal nodes that represent extant gene sequences or species.
Phylogeny
A phylogenetic tree that shows evolutionary descent from a common ancestor.
A phylogenetic tree is built by aligning DNA sequences and using an evolutionary model alongside a tree building method to cluster them based on evolutionary distance (or how closely related they are to each other).
Phylogenetic signal
The non-random similarity of related lineages found in genetic data. The ‘tendency for related species to resemble each other more than they resemble species drawn at random from the tree’ (Blomberg & Garland 2002). ‘Inferring evolutionary processes from phylogenetic signal is only possible when the measure of the latter is performed under the clear assumption of a specific trait evolution model’ (Cooper, Jetz & Freckleton 2010)
Phylogenetic non-independence
The concept that as species are related to each other they cannot be regarded as independent data points in statistical approaches of comparative biology.
Polyphyletic
A group that does not share a single common ancestor in the recent past E.g below, 3, 11 and 6.
Polytomy
Unresolved clade in a tree produced by a lack of phylogenetic signal i.e there is not enough information in the data to define the branching order.
Posterior probability
The probability that the tree is correct given the data, the prior and the likelihood model.
Reticulation
Joining of separate lineages on a phylogenetic tree through lateral gene transfer (also called horizontal gene transfer HGT, the acquisition of genetic material that isn’t from parent to offspring) or that occurs via hybridisation(breeding between separate species).
Sister taxa
The closest relative of taxa in the tree. E.g below are 5 occurrences of sister taxa.

Slice
Internal segment of an unrooted tree (see clan)
Substitution model
An evolutionary model that describes the rate of change from one nucleotide to another. (the correct model is estimated from the data). There are 64 nested models based on the GTR or general time reversible model.
Substitution models are used to calculate the likelihood of phylogenetic trees using multiple sequence alignment (so are implemented in both ML and bayesian tree building). E.g the simplest is the JC69 model where the probabilities of each substitution is equal and the base frequencies are equal.
Topology
The general organisation of a tree, or the set of clades that are in a tree e.g which taxa are grouped where. Tree topology summarises the patterns of evolutionary relatedness among a group of species independent of the branch lengths of a phylogenetic tree. Two different trees have the same topology if they have the exact same set of clades.
Tree shape
The characteristic shape of a tree (branch lengths and distribution of tips) that can provide information about evolutionary processes.
Tipiness
The distribution of node depths in the tree. The level of ‘tipiness’ can be quantified using Pybus’s gamma (y) parameter, this is used to measure rate variation through time.
A tree branching under a constant-rates model should have a balance of node depths γ around the midpoint (in depth) of the tree. γ is normally distributed around a mean of zero. Negative values capture early diversification, positive values capture, either, late diversification or higher extinction, especially early on. See here
In populations:
The number of individuals in a population that can pass on heritable information (called effective population size or Ne in population genetics) has a large effect on the evolution of populations, we can see this in the shape of a tree:
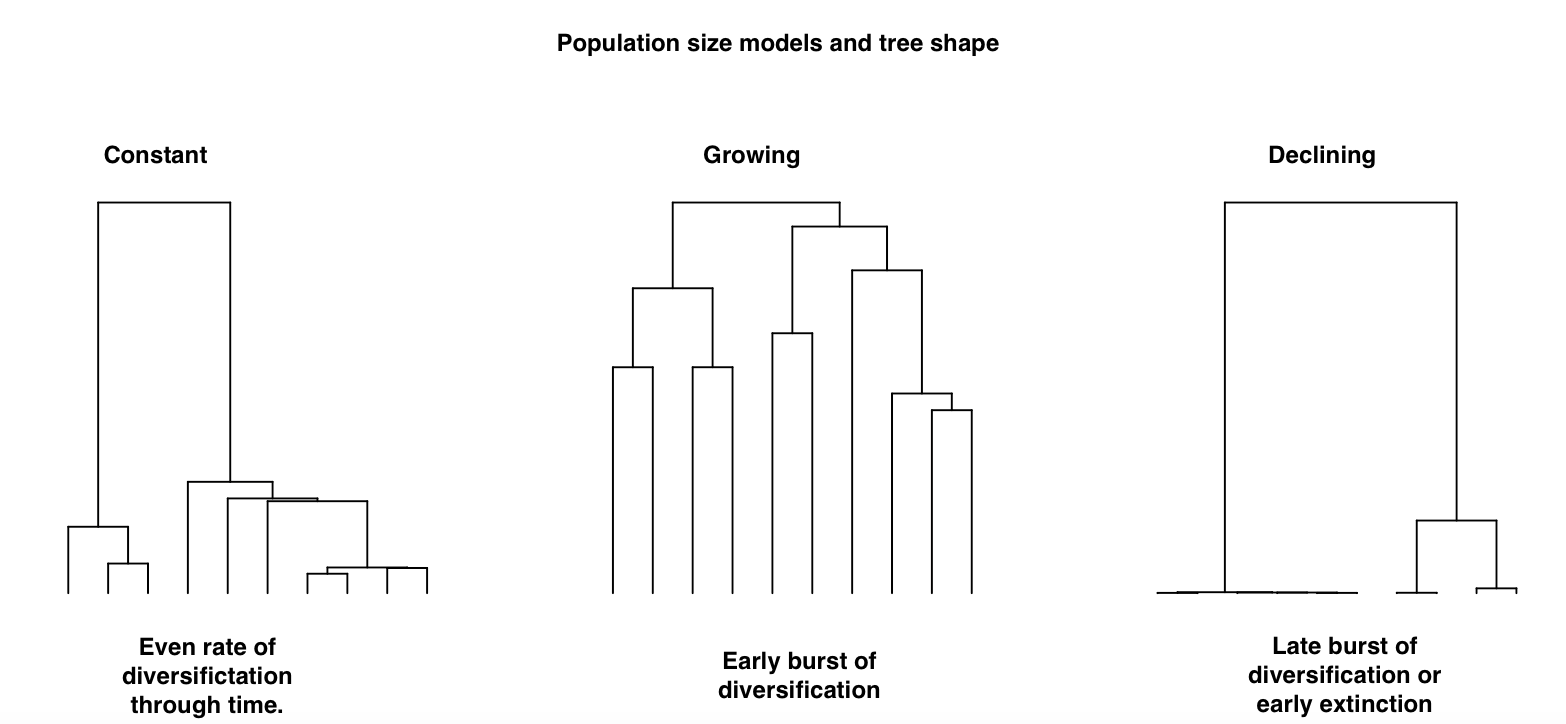
- When the population size remains constant over time you see an even rate of diversification through time.
- When the population size increases over time you see an early burst of diversification in the tree.
- When the population size decreases over time you see late bursts of diversification or early extinction.
Tree balance
The distribution of branches in clades across the tree, sometimes called ‘branchiness’. Balanced trees have an even distribution of branches in clades. Tree balance tests quantify lineage specific rate variation e.g Colless’ imbalance.

Vicariance
General term for speciation that occurs as a result of the separation and isolation of a group from an original population.
UPGMA tree (Unweighted Pair Group Method with Arithmetic Mean)
Assumes a molecular clock, produces a single rooted tree where the tips are all the same distance from the root. Useful when the data is ultrametric and the rate of evolution does not vary much across the branches of the tree.
All triplets in the dataset must conform to: Di,j < Di,k == Dj,k